
Auditing Bundle Sizes: How we dropped 18.7% from our sdk build
A week of upgrading Node from 20 to 24, bumping Vite from 5 to 7, converting config files to .mjs
for ESM compatibility. Everything I maintain gets regular audits. The treemap usually looks fine at
the top level. This time I decided to look at each chunk individually.
The Treemap That Didn’t Add Up
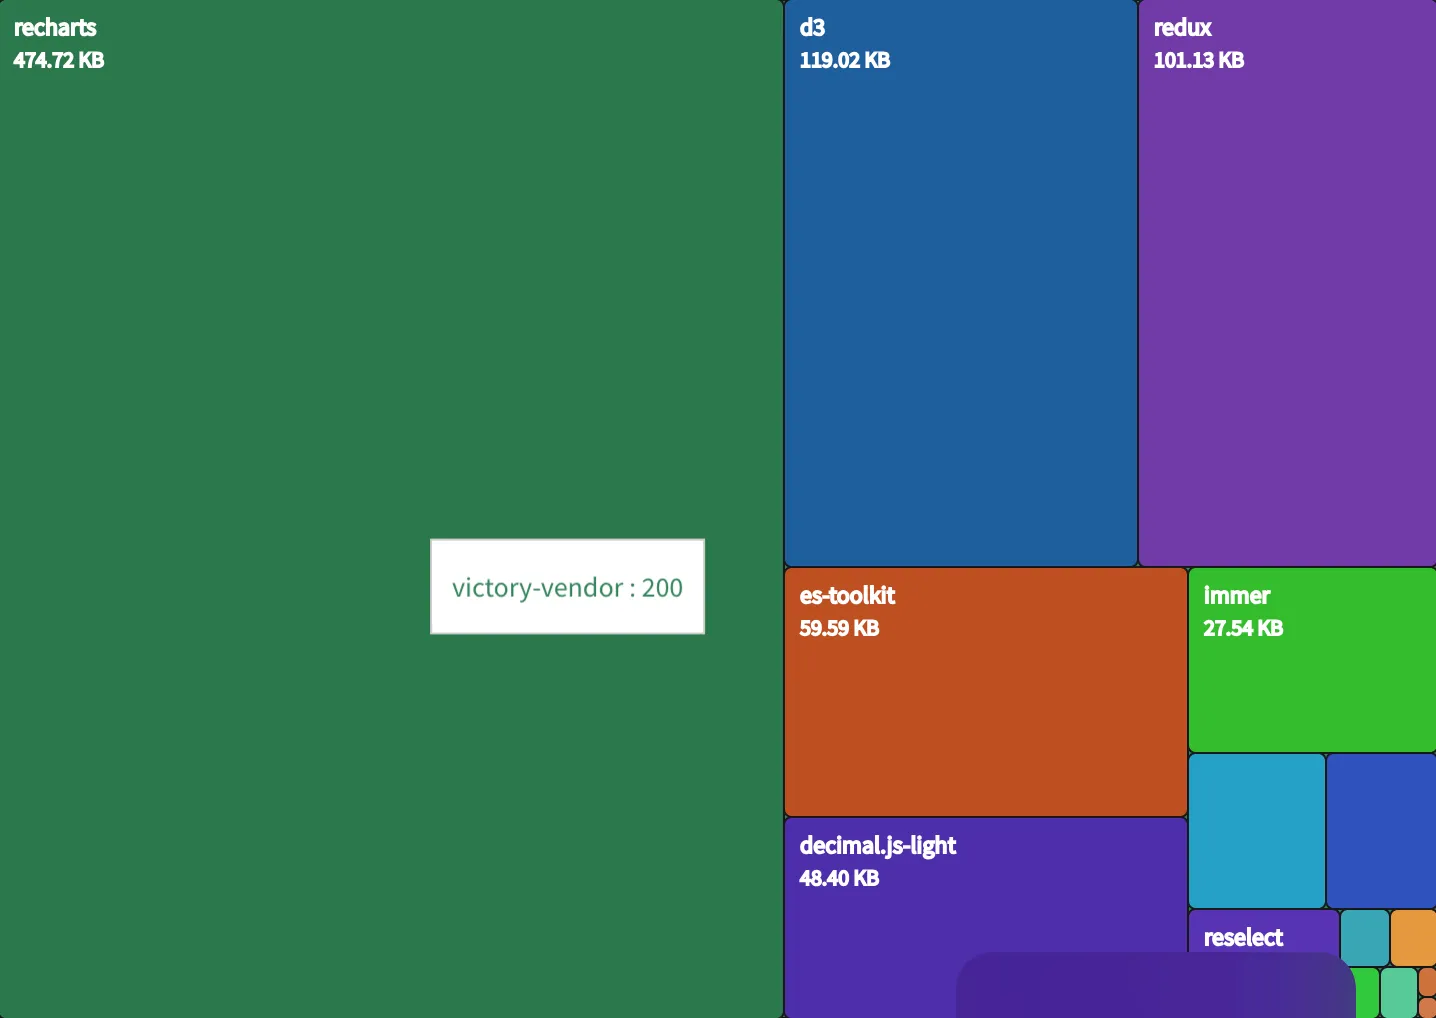
A treemap visualizes nested data as proportionally sized rectangles. In bundle analysis, each rectangle represents a module, and its area corresponds to the size it adds to the final build. Here’s a simplified example. When you look at one, the large blocks tell you where the bytes go.
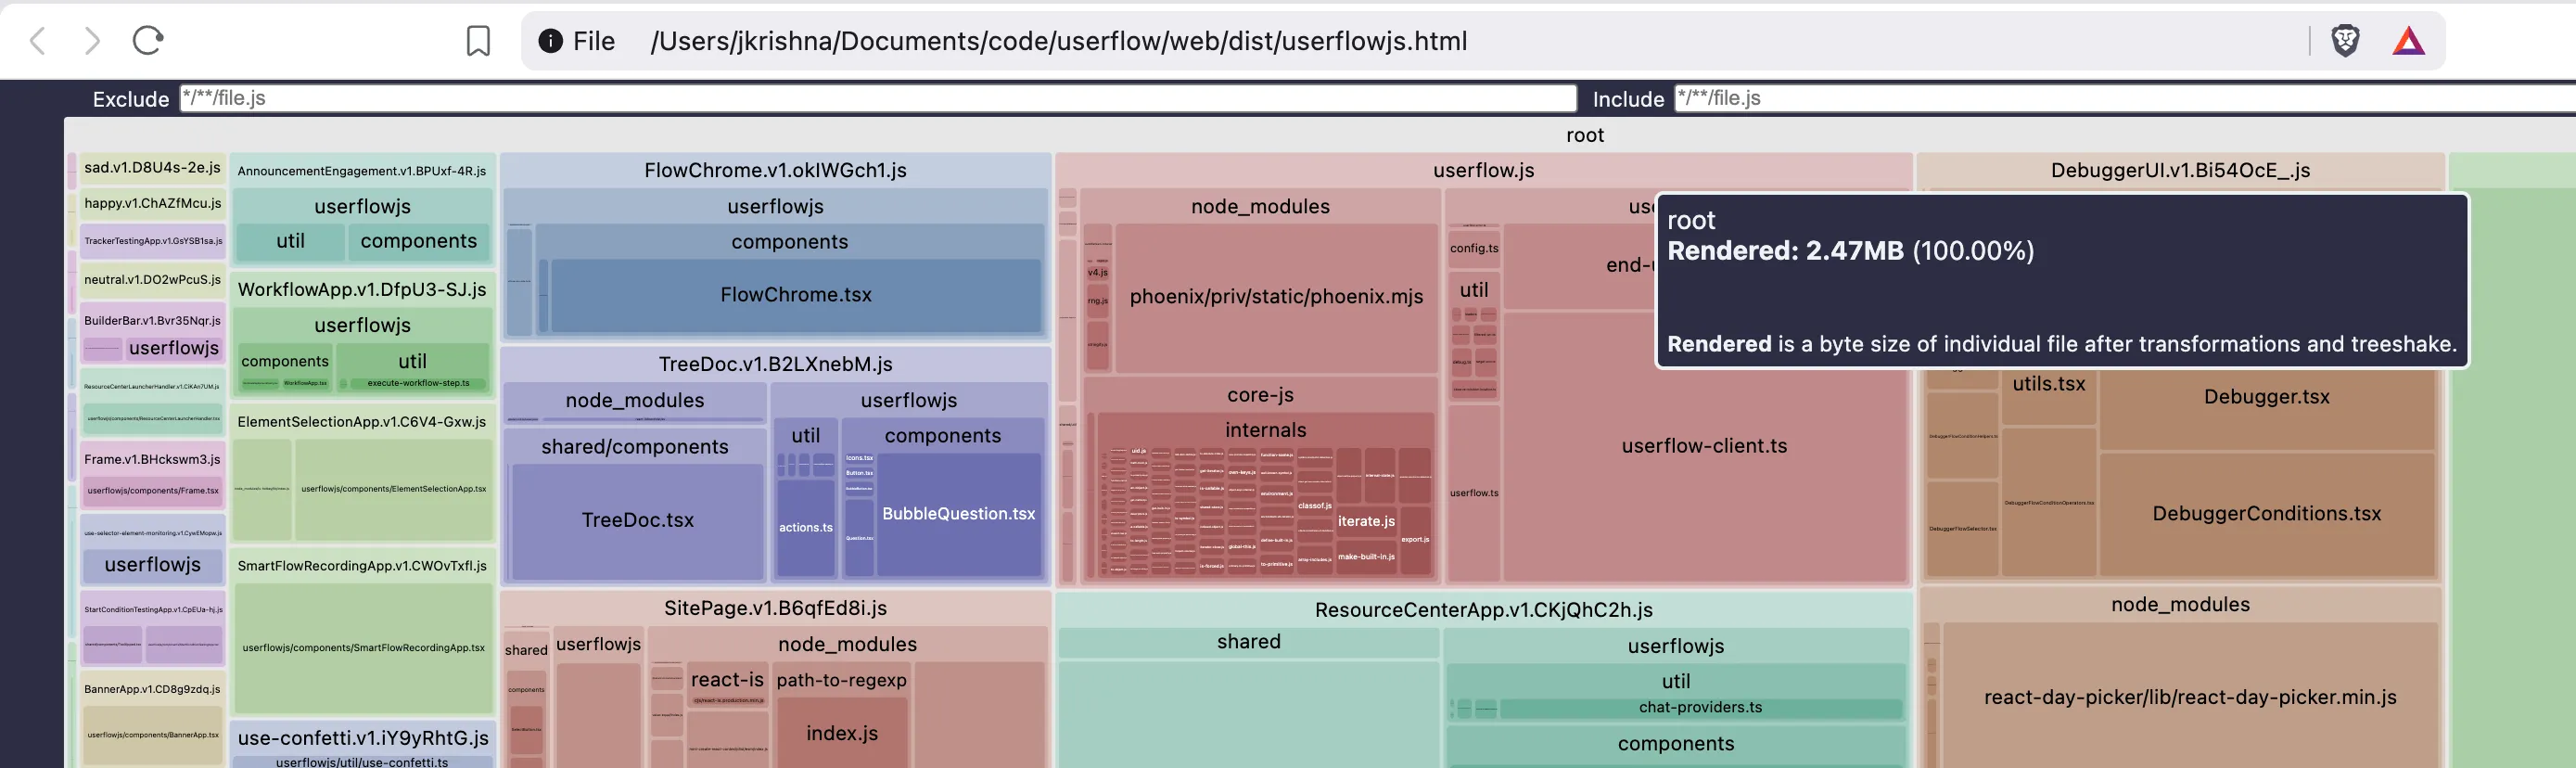
We build two production bundles: a modern build and a legacy build. The Vite upgrade gave me a
reason to regenerate the treemaps. The lodash block took up a quarter of the chart.
People overlook tree-shaking. Our bundlers have gotten efficient, so we assume the output is clean. A CJS dependency without proper export paths can slip in. A transitive import pulls in more than expected. An old barrel import survives three refactors because nobody checked the treemap. When you maintain an SDK or a legacy project, these blind spots compound. Your bundle is someone else’s page load. Keeping the footprint small is part of the job.
The codebase used lodash the way most codebases do:
import { debounce, get, cloneDeep } from "lodash";
// and the occasional
import * as _ from "lodash";
The named import syntax looks like ESM, and it’s easy to assume the bundler can tree-shake it. It
can’t. Under the hood, webpack translates import { debounce } from 'lodash' into a runtime
property access on module.exports. The syntax is ESM. The target is still CJS.
Tree-Shaking and Lodash
Tree-shaking relies on static analysis of ES2015 module syntax. When you write
import { debounce } from 'lodash', the bundler traces the import graph to figure out which exports
you use and prunes the rest. This works because import and export are static declarations. The
bundler knows at parse time what exists and what doesn’t.
CommonJS breaks this assumption. require() is a function call. You can conditionally require
modules:
if (process.env.NODE_ENV === "development") {
  const debug = require("debug");
}
Or compute the module path at runtime:
const mod = require(`./plugins/${name}`);The bundler can’t know which modules get required until the code actually runs. So it keeps everything. Rollup’s FAQ puts it directly: ESM allows static analysis that helps with tree-shaking. CommonJS is a legacy format that predates those optimizations. One analysis of module formats in bundlers shows the numbers: ESM removes roughly 95% of statically unreachable exports. CJS achieves around 40% due to conservative dynamic inclusion.
Lodash ships as a CJS bundle. The library re-exports every module through an index.js entry point:
import { debounce } from "lodash";The bundler pulls in lodash/index.js, which uses require() to load every module. require() is
a runtime call. The bundler can’t statically analyze what it returns, so it gives up and ships the
whole thing. Tree-shaking only works when the bundler can trace the dependency graph at build time.
CJS modules make that impossible.
This is where the sideEffects field in package.json comes in. It’s a hint to bundlers: “if no
export from this module is used, the entire module can be skipped.” Webpack 4 introduced it.
The
webpack docs explain that in a 100% ESM world, identifying side effects is straightforward. But
we don’t live in that world yet, so packages need to declare it explicitly.
Google’s
guide on tree-shaking covers the same ground.
lodash-es sets "sideEffects": false
in its package.json. That tells webpack and Rollup: “if a consumer imports only debounce, you
can drop everything else.” CJS lodash has no such field. The bundler treats every module as
potentially side-effectful and keeps the lot.
lodash-es exports with sideEffects: false:
The problem compounds when libraries re-export through barrel files.
One
analysis of this pattern shows that an index.js which re-exports child modules forces the
bundler to evaluate every child module, because the spec says side effects need to run even if the
export isn’t used. Without sideEffects: false, the bundler has no way to know which re-exports are
safe to skip.
Migrating to lodash-es would solve this. It ships ES modules with sideEffects: false, letting
bundlers eliminate dead code. But it requires full regression testing. The behavioral differences
between the two packages aren’t documented well. The risk wasn’t worth it for this maintenance
cycle.
The fix was simpler: change the import pattern to target individual modules.
// before - pulls in all of lodash
import { debounce } from "lodash";
import * as _ from "lodash";

// after - pulls in only what you need
import debounce from "lodash/debounce";
import cloneDeep from "lodash/cloneDeep";
This works because lodash/debounce.js is a standalone CJS file. The bundler doesn’t need to
tree-shake it. It resolves the single file and moves on.
This Isn’t a New Problem
The same pattern bit the React ecosystem when
react-awesome-query-builder
bundled all of @ant-design/icons. antd exported every icon through a barrel file. Libraries that
imported a single icon shipped hundreds of SVG components to production. The issue reporter used
source-map-explorer to prove it: the entire @ant-design/icons package appeared in the output
bundle.
antd fixed this by restructuring their exports and recommending direct path imports
(import CheckOutlined from '@ant-design/icons/CheckOutlined'). Library authors optimize for
developer ergonomics, clean barrel imports, at the cost of bundle size. The
import { X } from 'library' pattern reads well. It creates an implicit contract that CJS packages
can’t honor.
The Fix and the Guard Rail
I updated every lodash import across the codebase to use direct path imports. 30+ files. Mechanical work, but each one needed verification that the module path existed and the default export matched what the named export exposed.
I added an ESLint rule to prevent regressions:
// eslint config
plugins: ['lodash'],
rules: {
  'lodash/import-scope': ['error', 'method']
}
The import-scope rule set to method restricts imports to individual lodash modules. Any
import { ... } from 'lodash' fails at lint time.
The Numbers
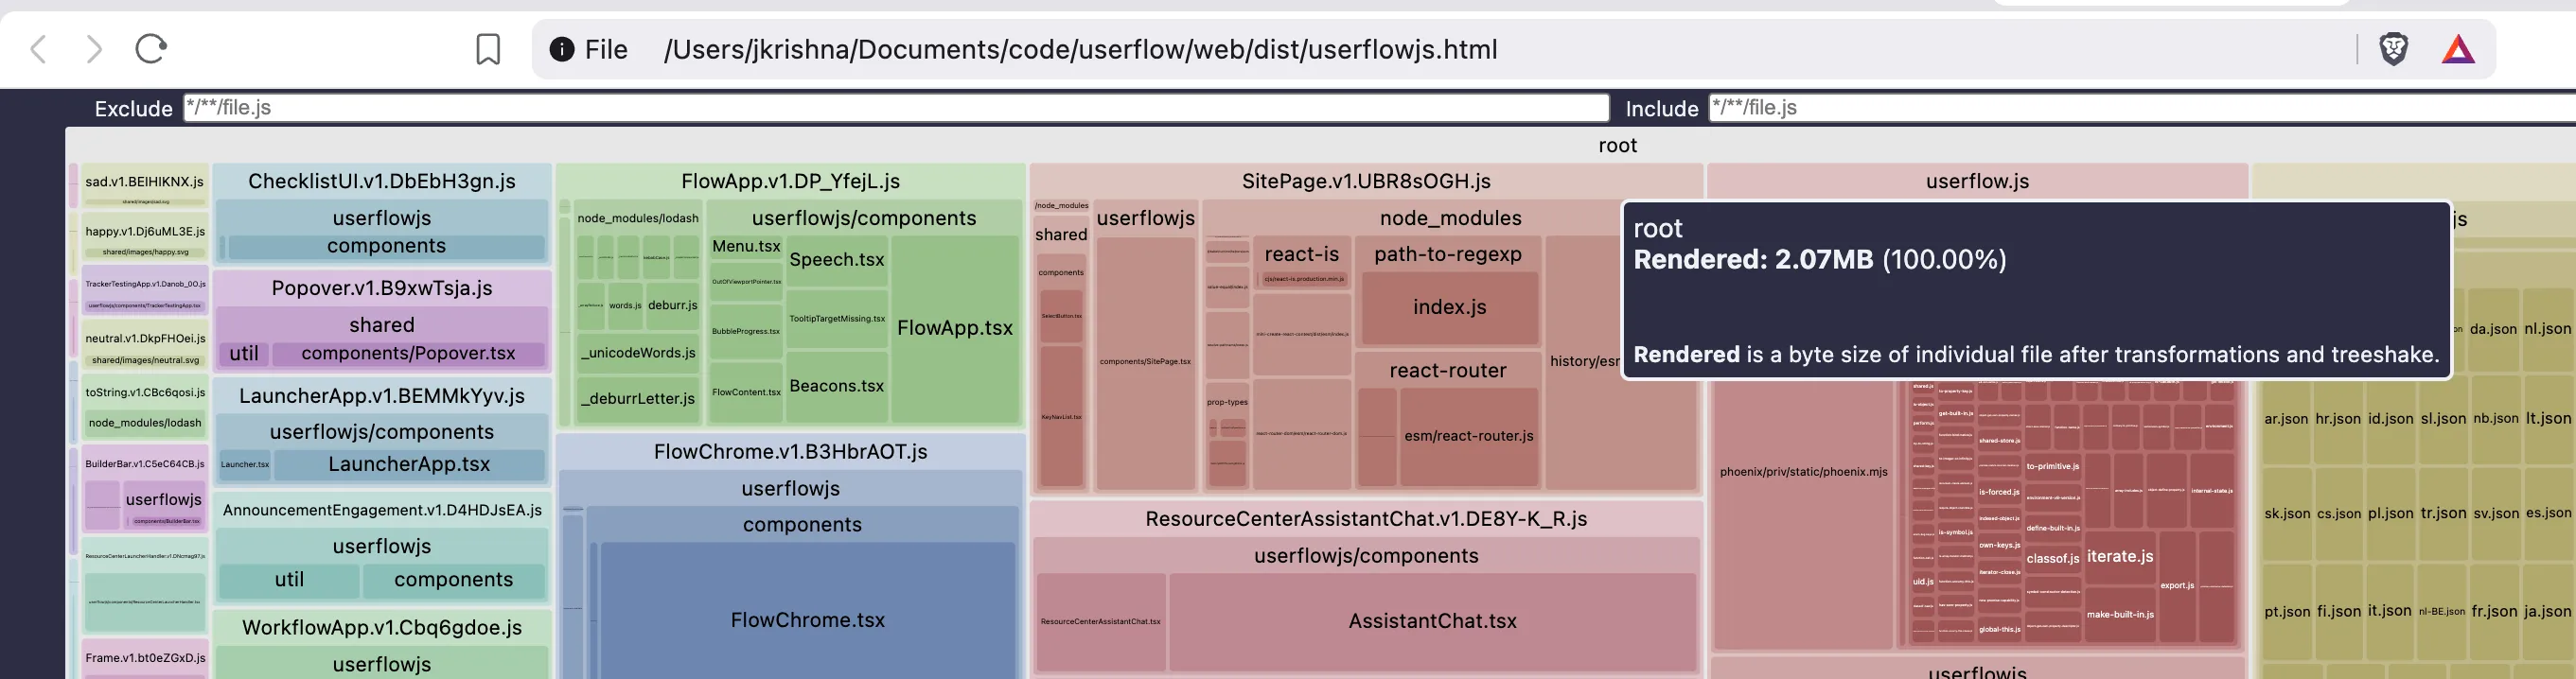
These numbers are the raw, uncompressed bundle sizes. In production, gzip (or Brotli) cuts them further. And the SDK doesn’t load in full for every visitor. Code splitting means browsers only download the parts the user needs. Still, the uncompressed size sets the floor for what gets transferred.
Modern build
| Build | Before | After | Savings | % reduction |
|---|---|---|---|---|
modern | 2.547 MB | 2.07 MB | -0.477 MB | -18.7% |
Why Regular Audits Matter
Bundle sizes drift. A dependency update adds a new transitive import. Someone adopts a utility library without checking how it ships. A barrel import sneaks in during a feature sprint. None of these changes look problematic in isolation. The treemap shows the cumulative effect.
Runtime cost
A smaller bundle means less JavaScript for the browser to parse, compile, and execute. On low-end phones with slow CPUs, the difference is measurable in main-thread blocking time. That blocking time delays interactivity. Every millisecond the parser spends on lodash modules it doesn’t need is a millisecond the user spends staring at a non-responsive UI.
Network bandwidth
We serve millions of requests per month. A 477 KB reduction (uncompressed) per request adds up. Across a month of traffic, that’s terabytes of bandwidth that never left our servers. Users on metered connections, slow networks, or congested cell towers notice the difference. The savings compound at scale.
Build speed
Smaller input means faster builds. The bundler processes fewer modules, resolves fewer dependency graphs, generates smaller source maps. CI pipelines finish faster. Developer iteration cycles shorten. When your build goes from 45 seconds to 30 seconds, and you run it fifty times a day, you get an hour back.
I run bundle analysis after every major dependency update. Vite’s build --profile flag generates
the treemap data. rollup-plugin-visualizer renders it. Fifteen minutes of scanning the top-level
blocks has caught issues that no code review would surface. Most of the time, the treemap confirms
everything is fine. Occasionally, it doesn’t.
The lodash fix dropped our SDK by nearly half a megabyte. Faster load times, less bandwidth consumed, smaller memory footprint on the client. For a library that loads on every page, those savings compound across page views.
Related Links
-
code-splitting.com
- A comprehensive resource on module formats, tree-shaking, and bundle optimization strategies